12th November 2021
by Matt Warburton
Why We’re Asking the Question
Over the past few months, we have received a similar request from multiple clients. And that is a way to generate an overall score when performing physical testing.
When running a testing battery there are often different characteristics that are being tested. It’s not always easy to generate one single number that can help explain to a coaching staff or front office member how the athlete performed during testing.
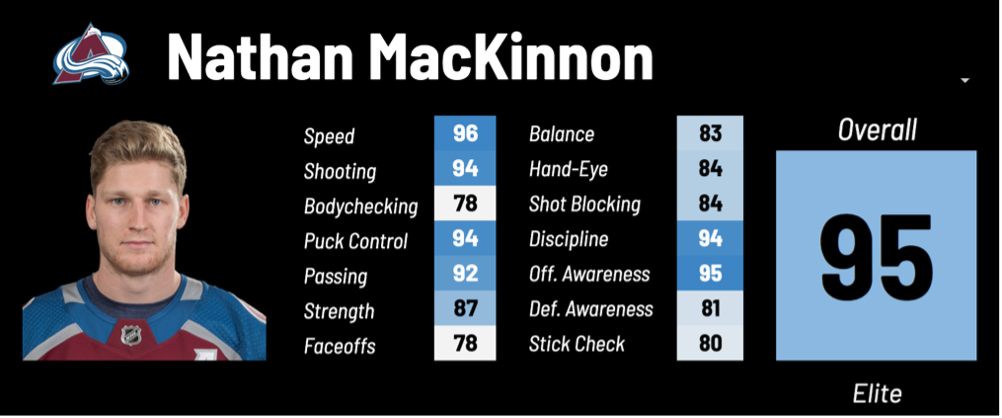
FIFA and NHL video games by EA sports have popularized the view of athlete's overall rankings in a general way. But when presenting this score in a real, high-performance setting, it is important to make sure that the scores are representative of what is being tested and has a solid methodology behind the calculation.
The Literature
The Total Score of Athleticism: Holistic Athlete Profiling to Enhance Decision-making was published in the Journal of Strength and Conditioning in 2019. The article provides a detailed account of how to capture an athlete’s performance and then how to rank them in comparison to other members of the team.
Published by Anthony Turner the director of postgraduate programs at the London Sport Institute, Middlesex University London. It includes a solid foundation of how the testing values are being calculated and what from. Using the methods from the paper, you start by creating a Z-score for the athlete on each test. The formula for calculating the Z-score is as follows:
Z = (Players testing value for test – Group Mean for test)
Standard Deviation of Group for test
Once the Z-score is calculated you take the average of that athlete’s Z-scores across each test performed to get an overall Total Score of Athleticism.
This accounts for how the athlete performed compared to the rest of the group for each test. It also incorporates the magnitude of how well on each test.
Looking at an Example
Using public data collected from the 2018 NFL combine, we can create the scores for all running backs who were tested.
The testing performed in the combine includes the following tests: Height, Weight, 40 Yard Dash, Vertical Jump, Bench Press Reps, Broad Jump, 3 Cone Drill, Shuttle Run.
It could be argued that a more appropriate set of tests could be selected, but for ease of use we wanted to used public data which included these tests; data was collected from https://www.pro-football-reference.com/draft/2018-combine.htm and imported into Kinduct.
Within the data, 31 running backs were tested.
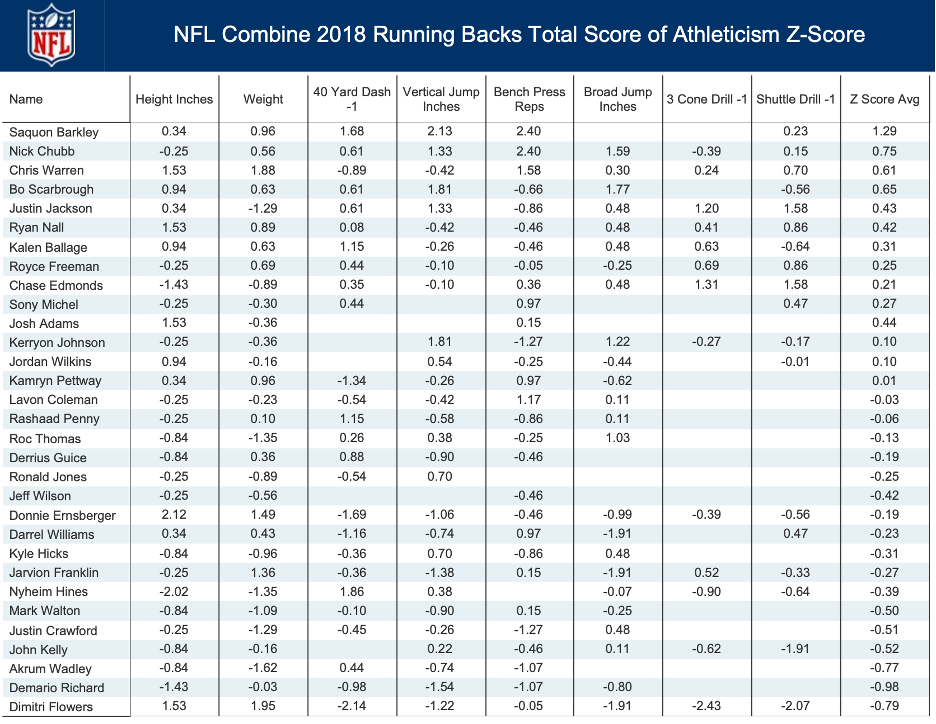
From the paper’s methodology, speed-based assessments where lower numbers are better are multiplied by -1. (This would include the 3 Cone Drill, 40-yard dash, and Shuttle Run.)
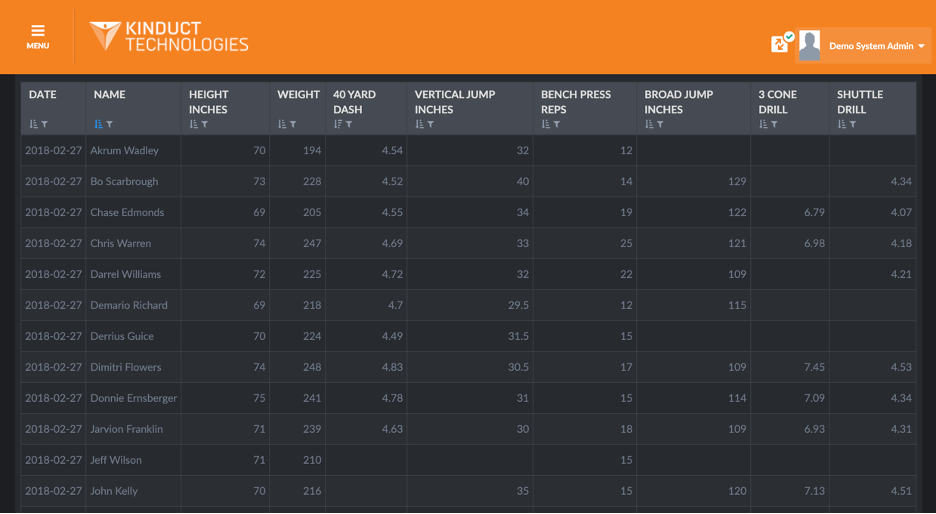
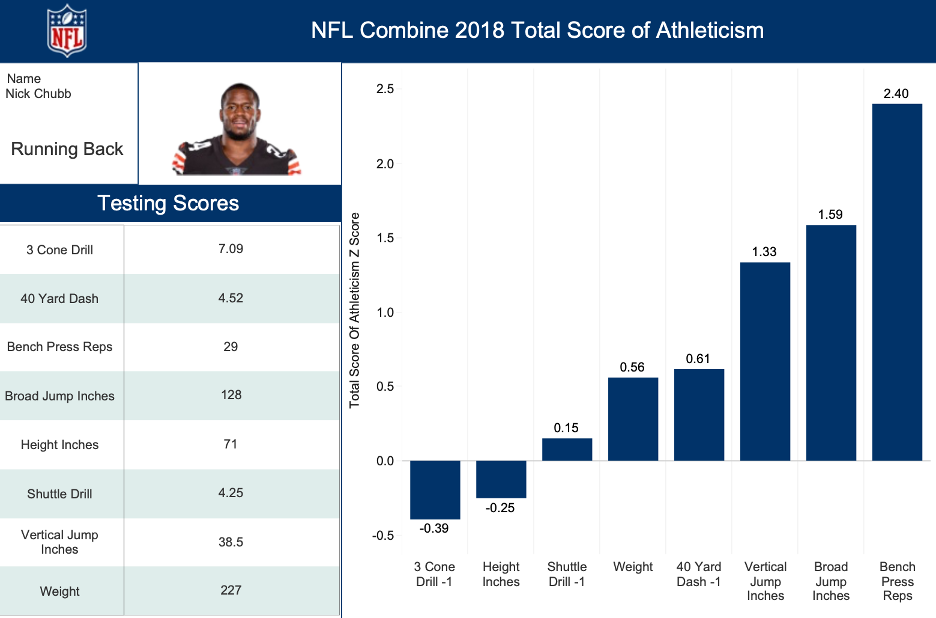
Once the data is set the Z-scores are calculated per test.
Here is an example running the Z-scores of the assessments after bringing the data into Kinduct.
A nice benefit to this methodology is that it accommodates for the athletes who did not complete all tests. Because the scores are normalized to each test it will take the score of all the assessments completed.
When we take the average of the Z-scores we can see the total scores visualized from low to high. Based on the Total Score of Athleticism scoring criteria, Saquon Barkley, who was selected 2nd overall in the draft, had the strongest performance.
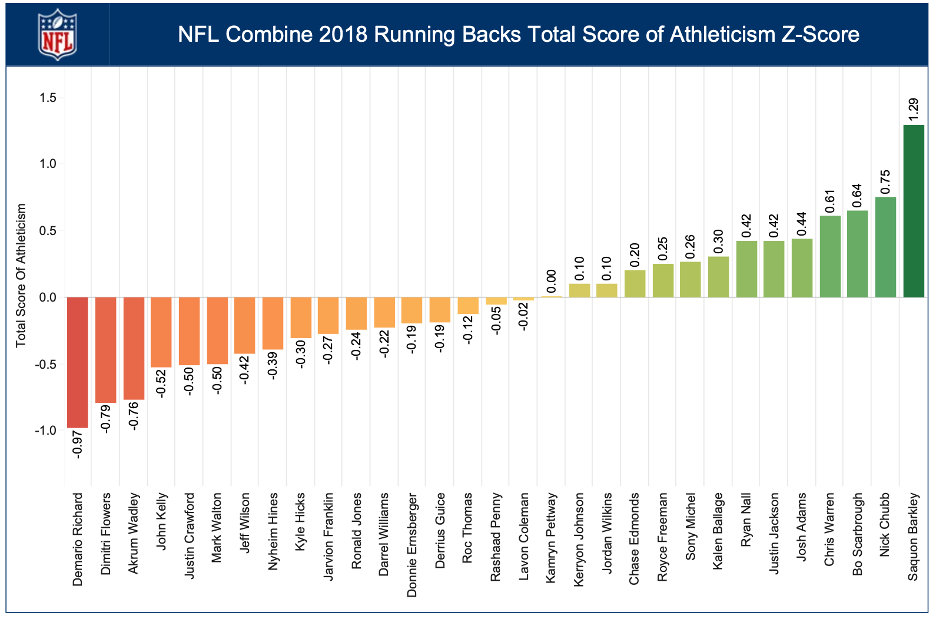
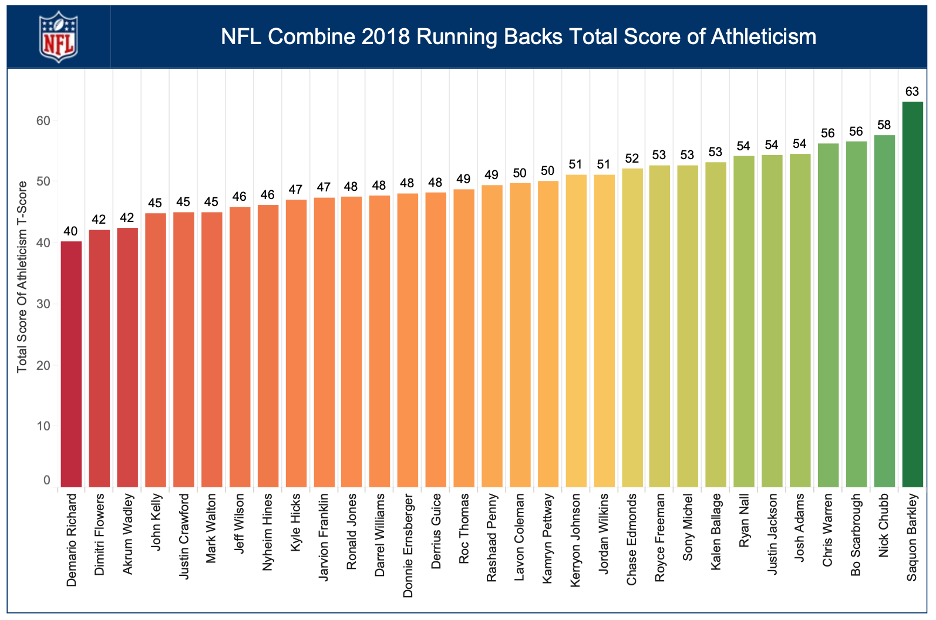
As mentioned in the paper, these Z-scores can be converted to a 0-100 scale. This makes it easier to digest and distribute to other coaches or practitioners.
The conversion for this is: T-score = (Z-score * 10) + 50
Once you have the report set up you can then interpret and make decisions based on your analysis. It is important to note the score will only be as good as the tests selected.
Adding this report to your Kinduct site with the ability to choose your specific testing battery is now available. Once it is set up with the tests used the next time testing rolls around the report can be generated and printed off for your coach within minutes.
Related articles