11th March 2020
Graham Stark is a Sports Scientist at Firstbeat where he helps and supports clients in maximizing the data they have available so they can get the best insight possible. Prior to arriving at Firstbeat, Graham worked as a Sports Scientist in the English Premier League for a number of years and has experience working with teams on a day-to-day basis.
1) Firstbeat is well known for its Heart Rate Variability (HRV) tracking. How is HRV different from your normal heart rate, and why is it important?
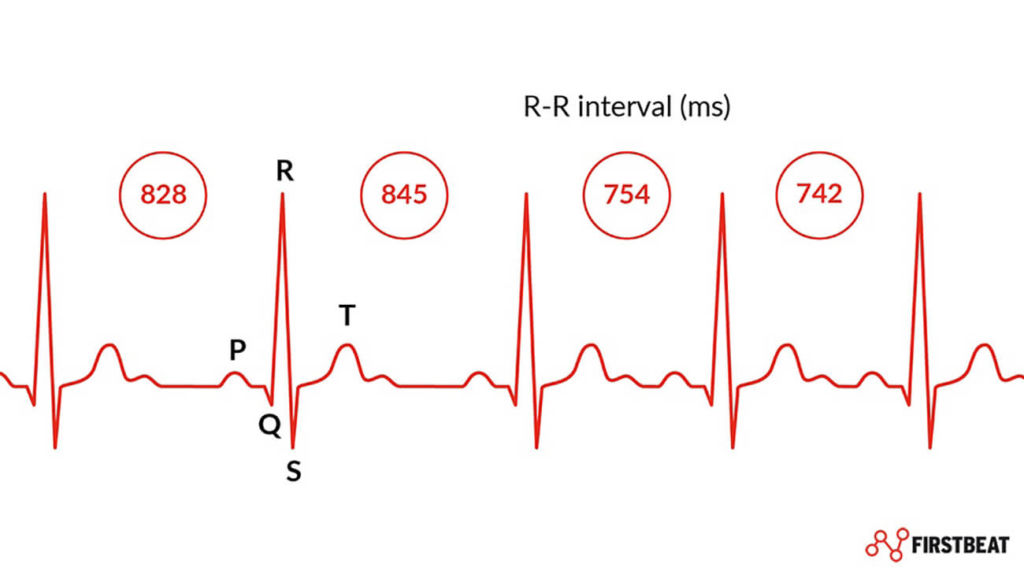
HRV takes every beat-to-beat time difference whereas heart rate is just that, the average number of beats each minute. But those beats could be composed very differently. 120 bpm (beats per minute) could be 120 evenly spaced heart beats each minute, or it could be that the individual has periods of 150bpm and 90bpm across the time period. These scenarios would present very different physical responses. Heart rate naturally fluctuates to maintain homeostasis, so we want to see that variability because it shows how the autonomic nervous system is reactive to changes within the body. By using HRV, we can delve much deeper into the way the body is responding to an activity or any given stressor, providing more insightful and usable information than HR alone.
2) What goes into producing Firstbeat’s heart rate analytics?
Our analytics are research led and tested in the lab to ensure they are showing what we claim! The background calculations use a combination of HRV, neural network models, and individual scaling to create a digital picture of an individual’s unique physiology.
3) Firstbeat prides itself on bringing laboratory accurate results to the field. How is this possible and why is it useful for athletes and coaches?
It’s possible thanks to the advanced analytics we use. As mentioned above, the neural network modelling opens up a whole new world of possibilities in terms of what we can calculate. To achieve lab accuracy, you’re normally testing under controlled conditions in a laboratory. This can be both time consuming and expensive, as well as somewhat detached from the actual sport (depending on the specific event). By making this information field accessible, we’re giving coaches and athletes data that is trustworthy and reliable.
4) What are some physiological variables that affect HRV? Can environmental elements such as weather affect it too?
In a sporting context, training will have an affect HRV because it induces peripheral fatigue, which in turn will have an impact upon central fatigue and the responsiveness of the autonomic nervous system. But really everything we do affects our HRV — anything from a gentle walk to a HIIT (high-intensity interval training) to a heavy lifting session — and the weather can also have an influence.
For example, heat stress is a pretty hot topic (excuse the pun!) right now ahead of the Tokyo Olympics. Conversely, extreme cold weather, as both conditions make an activity harder on the body. These factors, in turn, will change the response during an activity, but also the recovery demands afterwards. This is part of the beauty of using HRV — it captures everything. If a session is made harder because of the weather or an athlete being dehydrated or sleep-deprived, we want to know about it rather than assuming a given external load is the same in all conditions.
5) Is stress a large proponent when it comes to HRV? If so, does that make it especially important to track for professional and elite-level athletes who are under pressure and constantly in the spotlight?
There’s plenty of evidence (Delaney & Brodie, 2000; Slimani et al., 2018) around that shows things like school and work stress can cause a decrease in HRV within the general population, so it’s widely accepted that mental stress has an impact. Furthermore, there’s evidence to suggest mental stress is a risk factor for injury in athletes. Elite level athletes are under a huge amount of mental stress these days, not just around the sport itself and all the pressures to win/perform well but also from the media spotlight and the ever-increasing demands of social media. Tracking this is definitely an important part of the monitoring process these days as it can help to identify the stressors that we can do something about. You’ll never remove the external mental stress but if we as practitioners can help an athlete to manage that a bit better, find a restful moment for themselves here and there then that will go a long way to help keep them mentally fresh and sharp.
This is where the Firstbeat 24/7 Stress & Recovery assessments can be a wonderful tool as they not only quantify whether an individual has a healthy stress/recovery balance but also show where in the day these events occur. If we know, for example, that doing press conferences is particularly demanding for an individual we can help devise strategies around that to reduce the impact.
6) What are the key insights coaches should be looking for in their athlete’s HRV data?
When we’re looking at a resting HRV test (called a Quick Recovery Test in the Firstbeat Sports platform) we’re looking for trends over time and asking if they are as we expect. In periods of heavy training load, you would expect QRT scores to be down — likewise in a tapering period when you expect them to improve. So we want to look at whether those general trends tie-in with one another. If they don’t, then we can try to find out why. In this example you’d probably be looking at 7-day QRT average alongside acute training load (i.e. 7-day training load). Daily HRV can also provide an insight into readiness to train, so you might also use it to adjust daily loads, increasing them when an athlete is in good shape and reducing them when they’re still showing signs of fatigue. This maximizes days when they can cope with extra loading, but ensures appropriate recovery is facilitated as well.
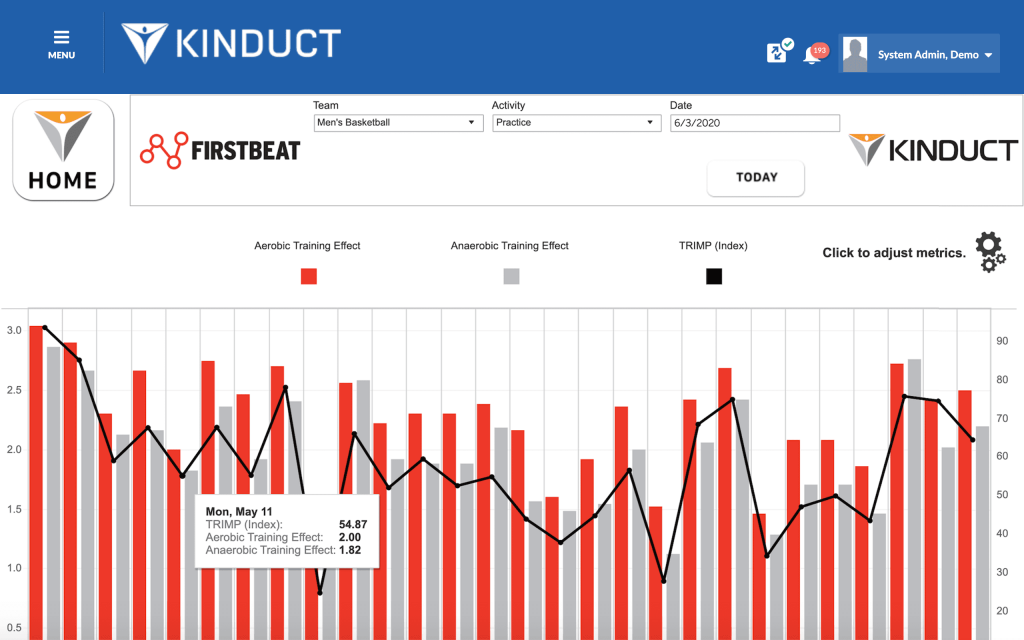
7) Firstbeat also tracks other insights and metrics such as EPOC, Training Effect, Training Impulse (TRIMP), and Quick Recovery Test (QRT) — how are these defined and how does HRV data inform these measurements?
HRV goes into every metric that is unique to Firstbeat, as are EPOC, Training Effect, and QRT. However, TRIMP is a more general calculation that provides an exponentially weighted quantification of training load based upon the %HRMax that an individual is working at.
EPOC is the “Excess Post-Exercise Oxygen Consumption,” which is more commonly called “Oxygen Debt.” It basically quantifies how much disturbance has been caused in the body by an activity and how much needs to be “paid-back” to return to resting levels. Much like a loan you take out for a purchase, the bigger the loan the longer it takes to pay back and return you to square-one. We use HRV to calculate this live during a session, and this is where the neural network modelling comes in: from calculating VO2 we can then calculate EPOC by subtracting the area under resting VO2 from the area under the recovery VO2 curve.
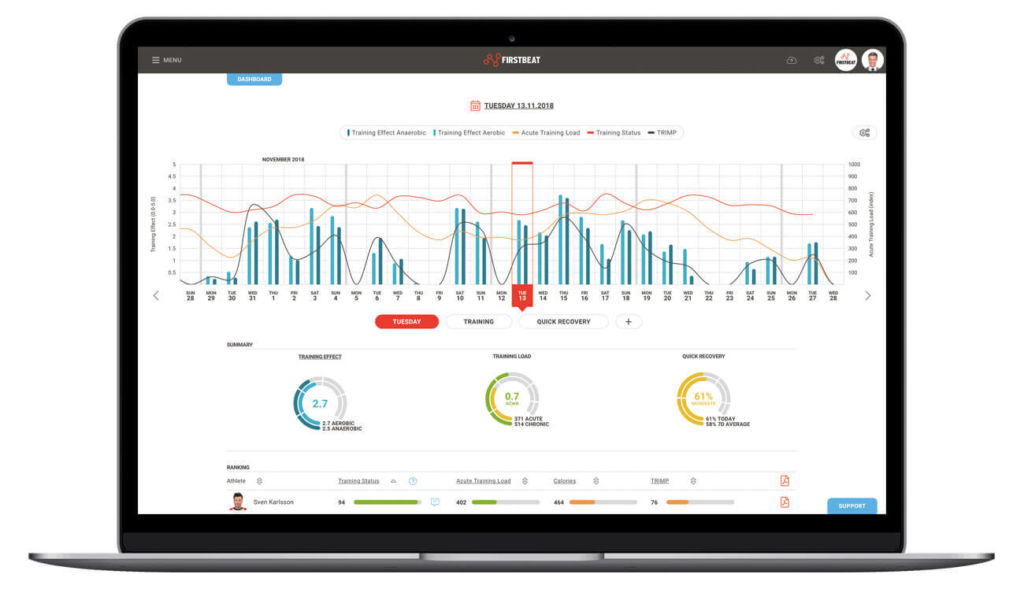
Training Effect is broken down into aerobic and anaerobic variants, which indicate how hard an activity is/was on a 0-5 scale. The aerobic version is based upon EPOC and takes an individual’s background information into account. A highly trained athlete will need to accumulate greater EPOC than a inferior-trained person to achieve the same training effect. Anaerobic Training Effect uses interval detection to identify periods of anaerobic work; this includes a multitude of factors such as peak intensity, interval duration, recovery periods / work:rest ratio, HR gradient, and elapsed training time amongst others. The two Training Effect numbers help to normalize all of the complex training data, making it easy for coaches and athletes to understand and interpret on the individual and squad level.
The QRT is another metric to normalize more complex data; HRV would typically be expressed as RMSSD (Root Mean Square of the Successive Differences) but each individual will have different baselines. Similarly, the Coefficient of Variation over a period indicates level of recovery too, and there tends to be less variance day-to-day when an athlete is well recovered. Therefore, QRT takes all of this into account to provide a % score of recovery, again making it easy to use and compare across a squad.
8) After HRV data is ingested into an Athlete Management System, what other metrics are best to compare it to?
Acute training load has already been mentioned, and this metric, when paired with some of the other longitudinal measures such as the Acute:Chronic Workload Ratio and Training Monotony, are good places to start. You’re looking to establish those trends over time to get a picture of how your athletes are coping and any adaptation. On a daily basis you could also use HRV alongside your other readiness data to give a more complete picture. Variables such Reactive Strength Index, urine or blood markers, and/or subjective well-being questionnaires would all complement what you’re seeing in the HRV.
While internal load ultimately determines the training outcomes, it is good to compare the dose-response relationships with external load to get more precise information on where the players are and why. While internal load, external load, and subjective feelings typically correlate with each other, the most important thing is to identify moments when these variables deviate from the normal responses.
Interested in more industry insights? Check out our previous Integration Spotlight on EliteForm, a 3D motion capture system used for velocity based training (VBT).
Related articles