


Next steps in movement digitization
Next-gen gaming, live-streaming, digital health, and autonomous robots. Unprecedented levels of athletic achievement. Artistic innovations that amaze and delight audiences of all ages. Movella’s full stack technology to capture, digitize, and analyze movement is changing the world for the better.
Movella: a leading innovator in digitizing movement
Lights, camera, capture! Spotlight on astonishing entertainment solutions.


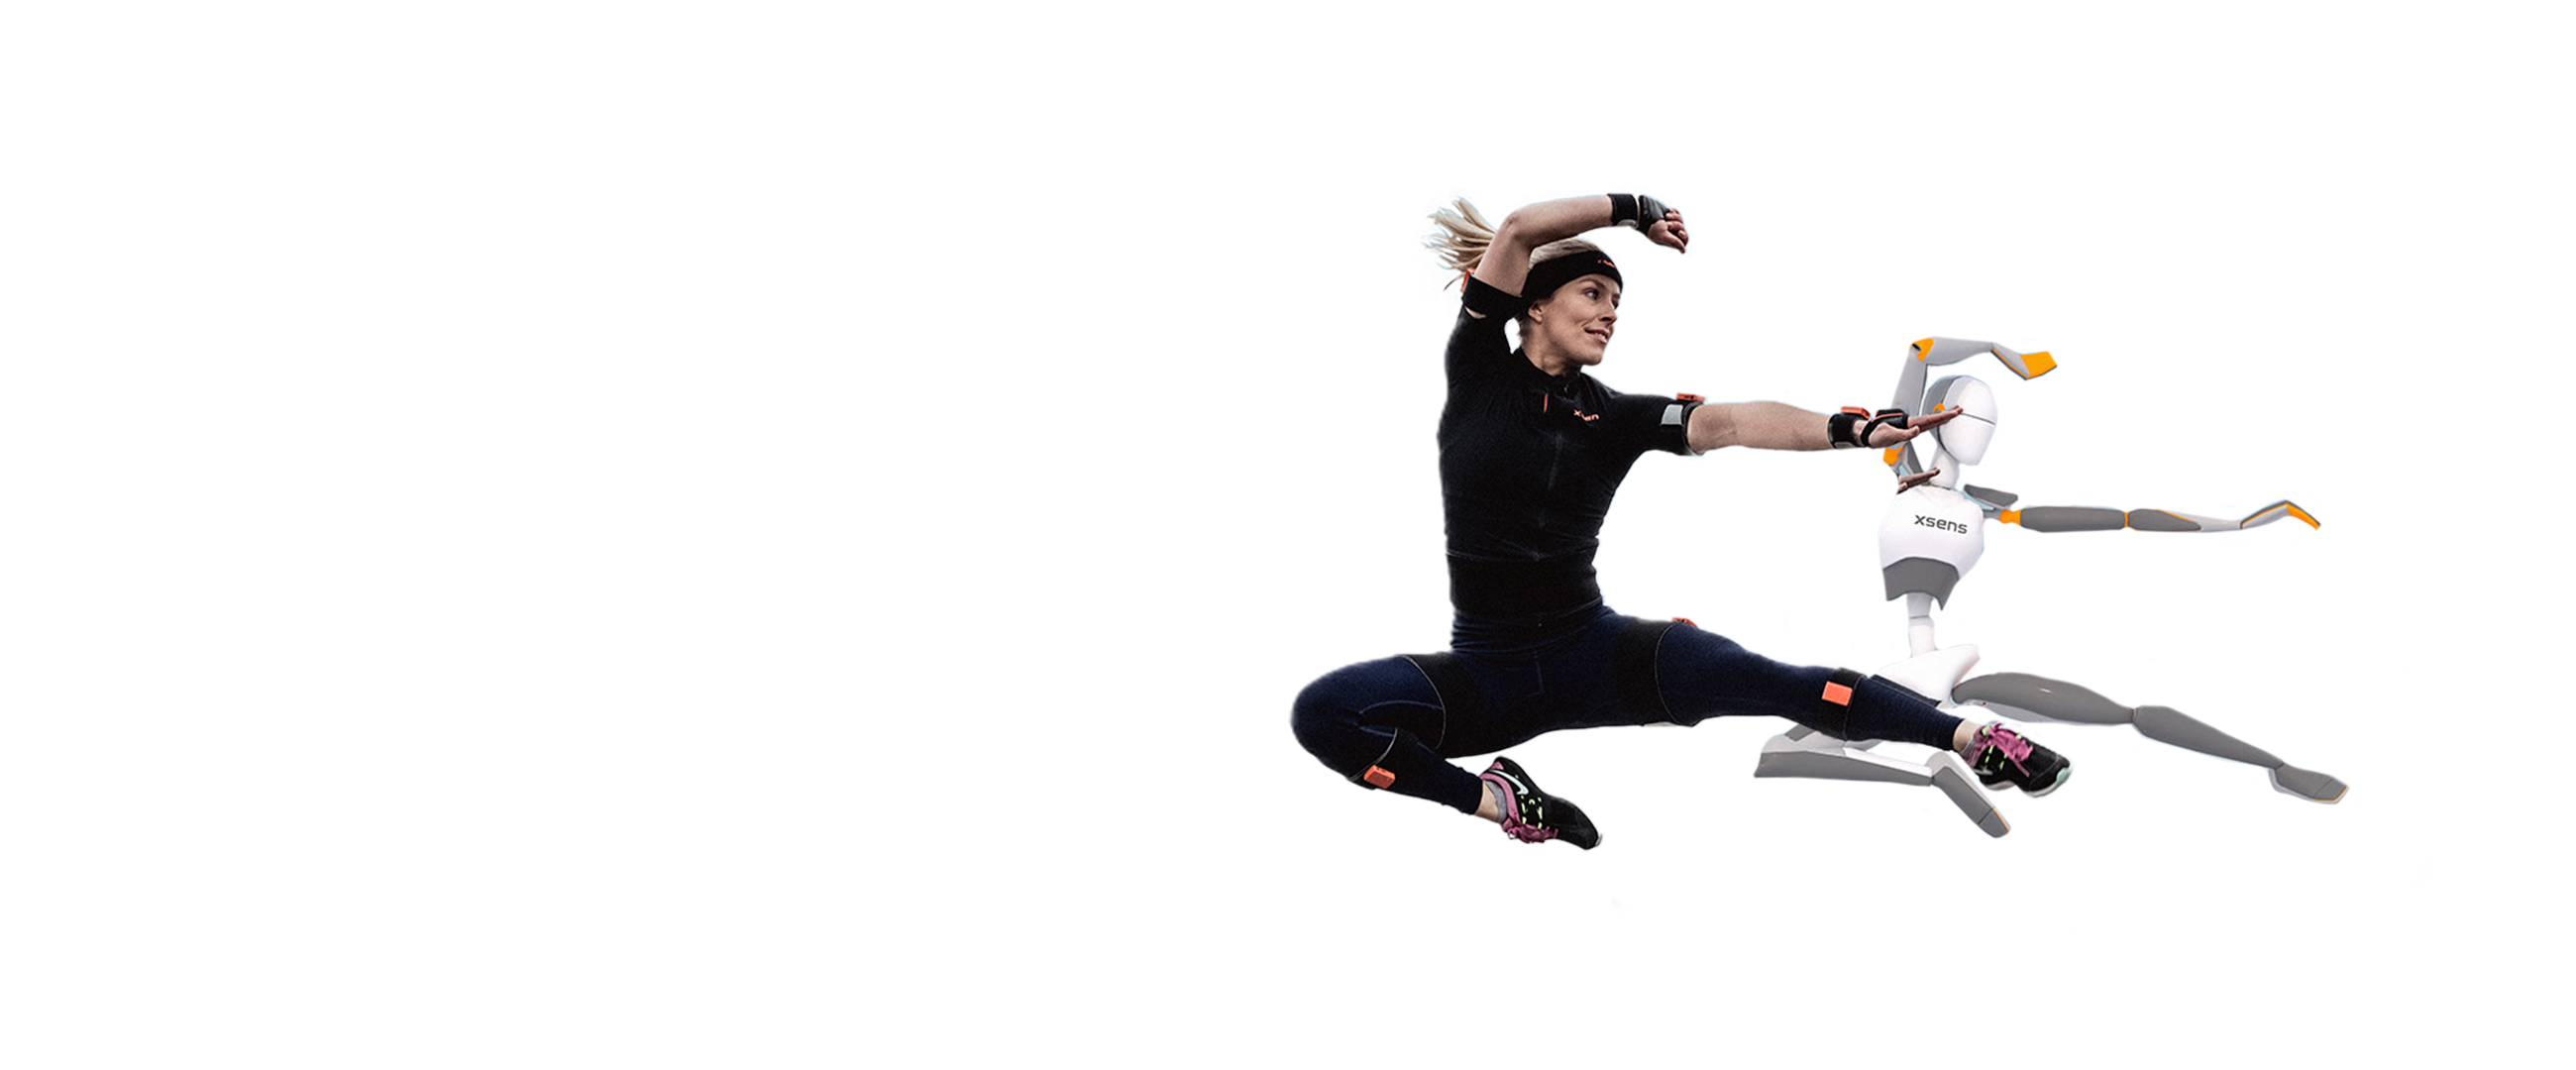
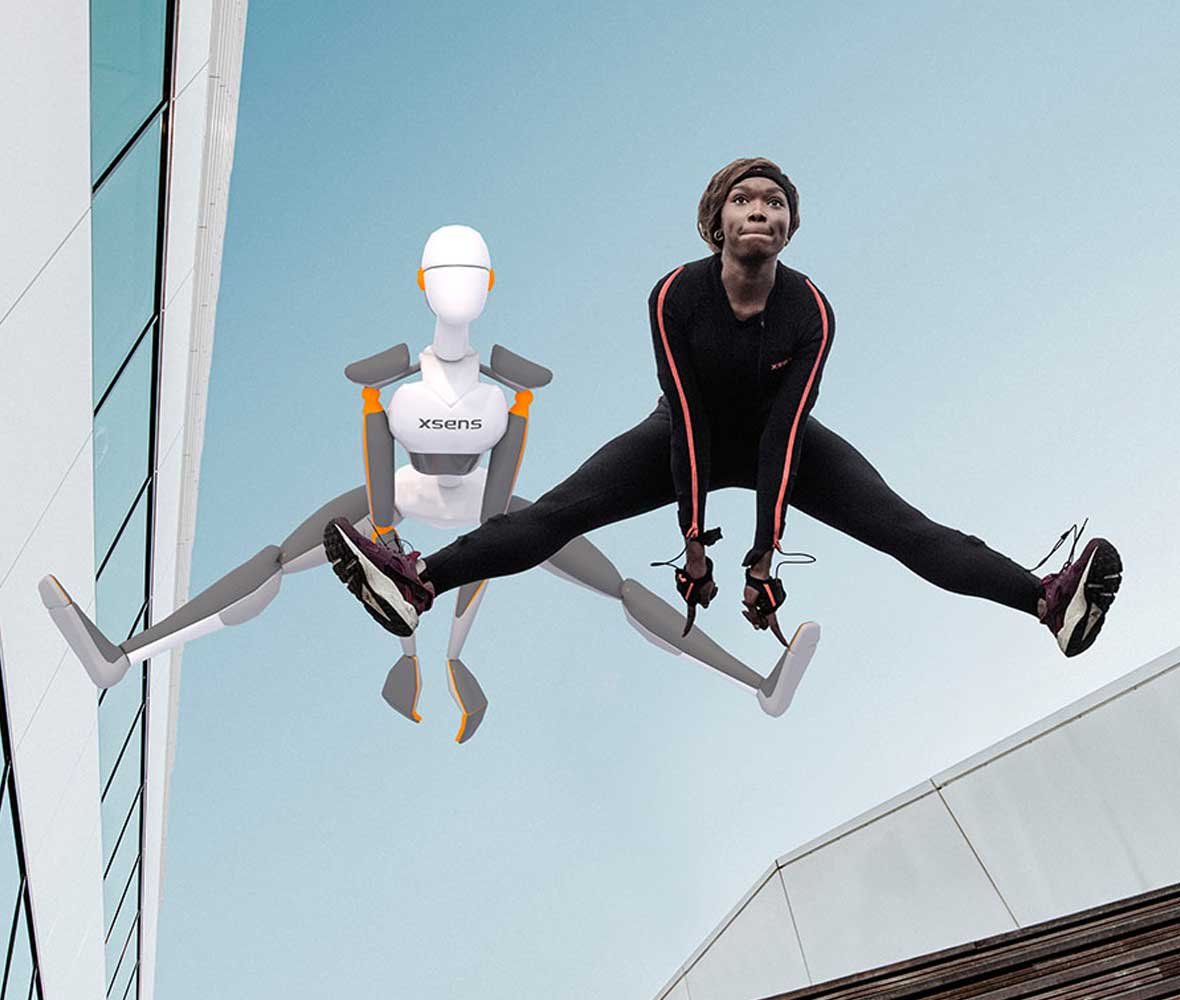
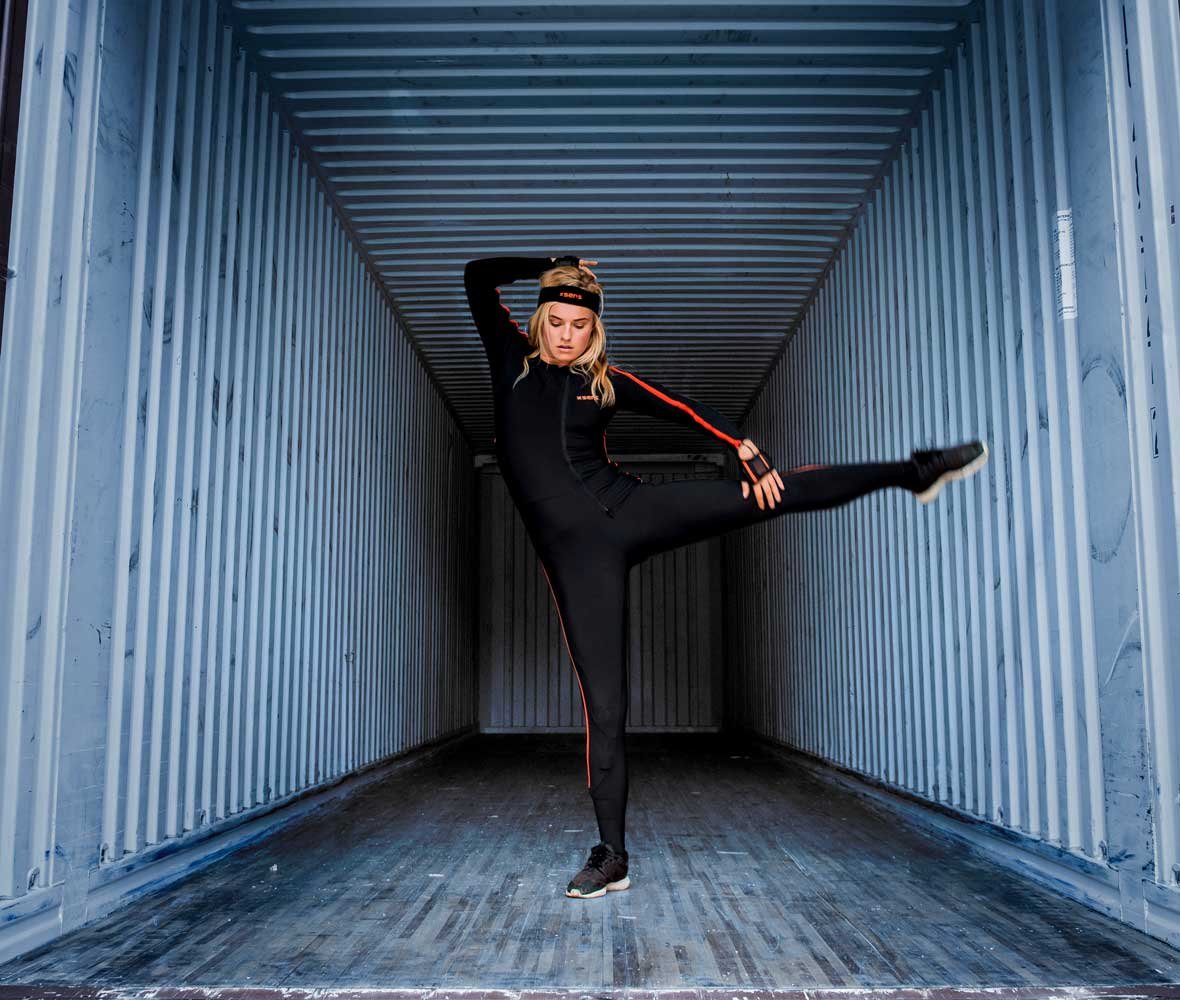
Breakthrough solutions that help athletes break records.

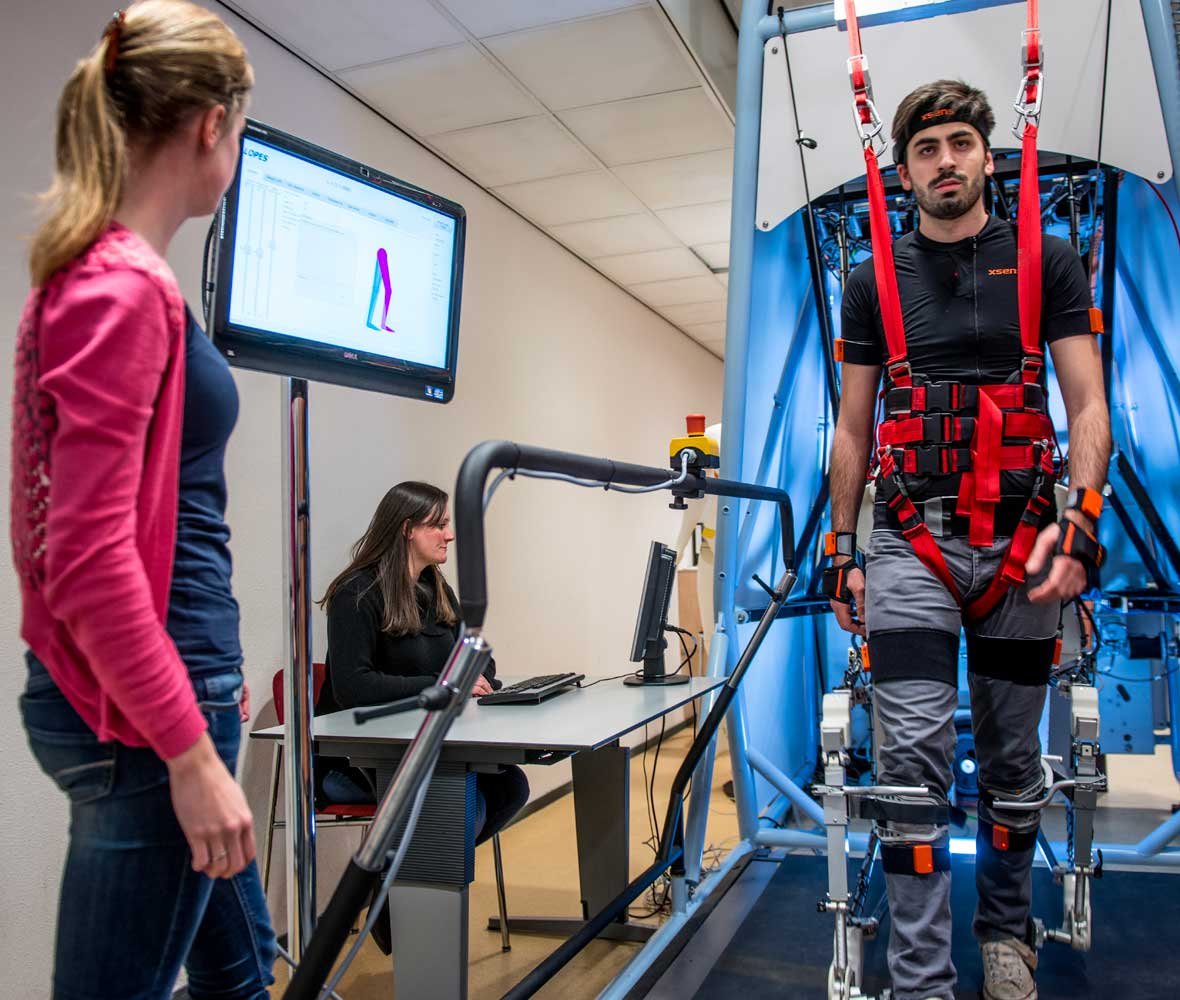
Helping people get back on their feet by removing the barriers to movement.

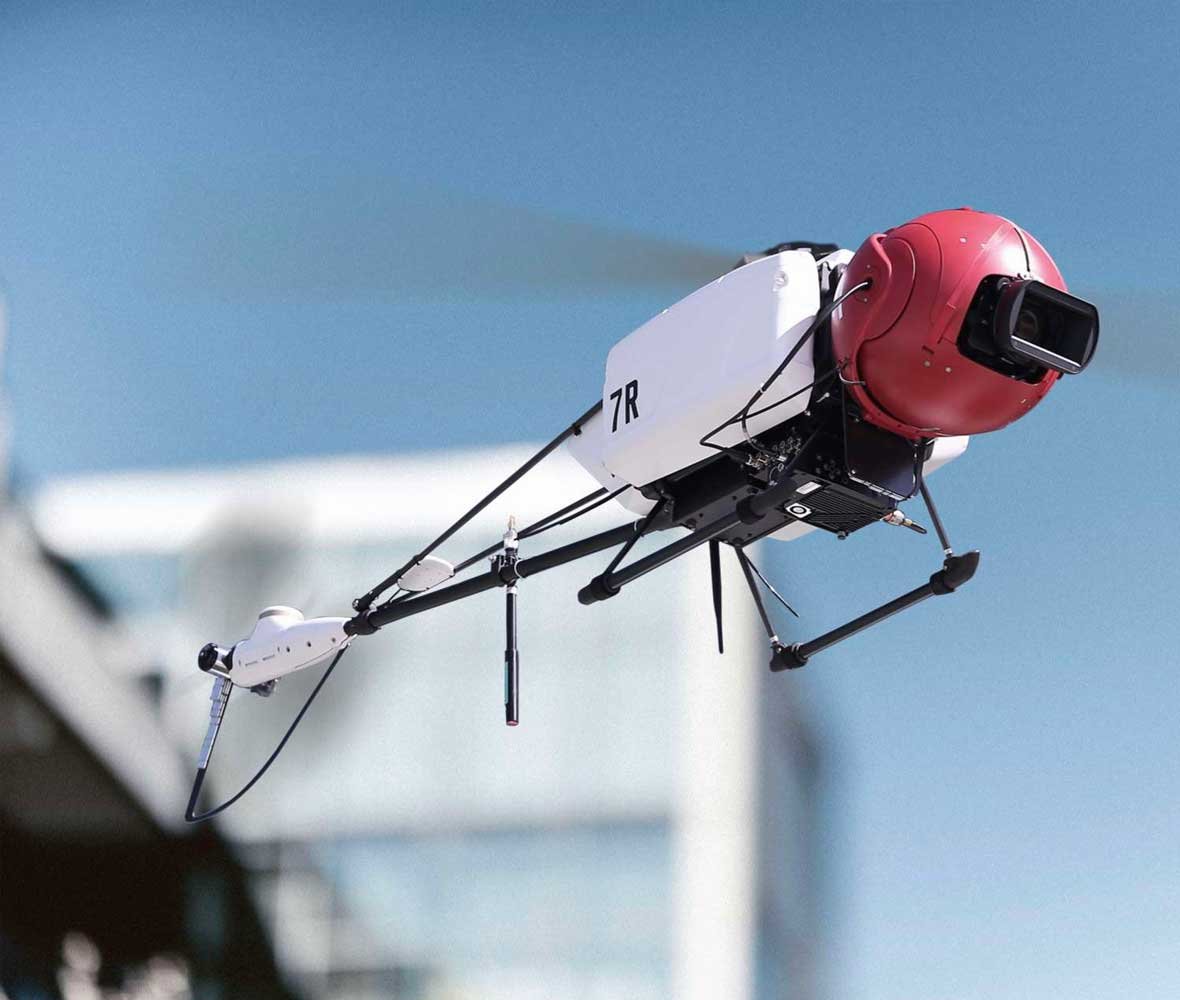
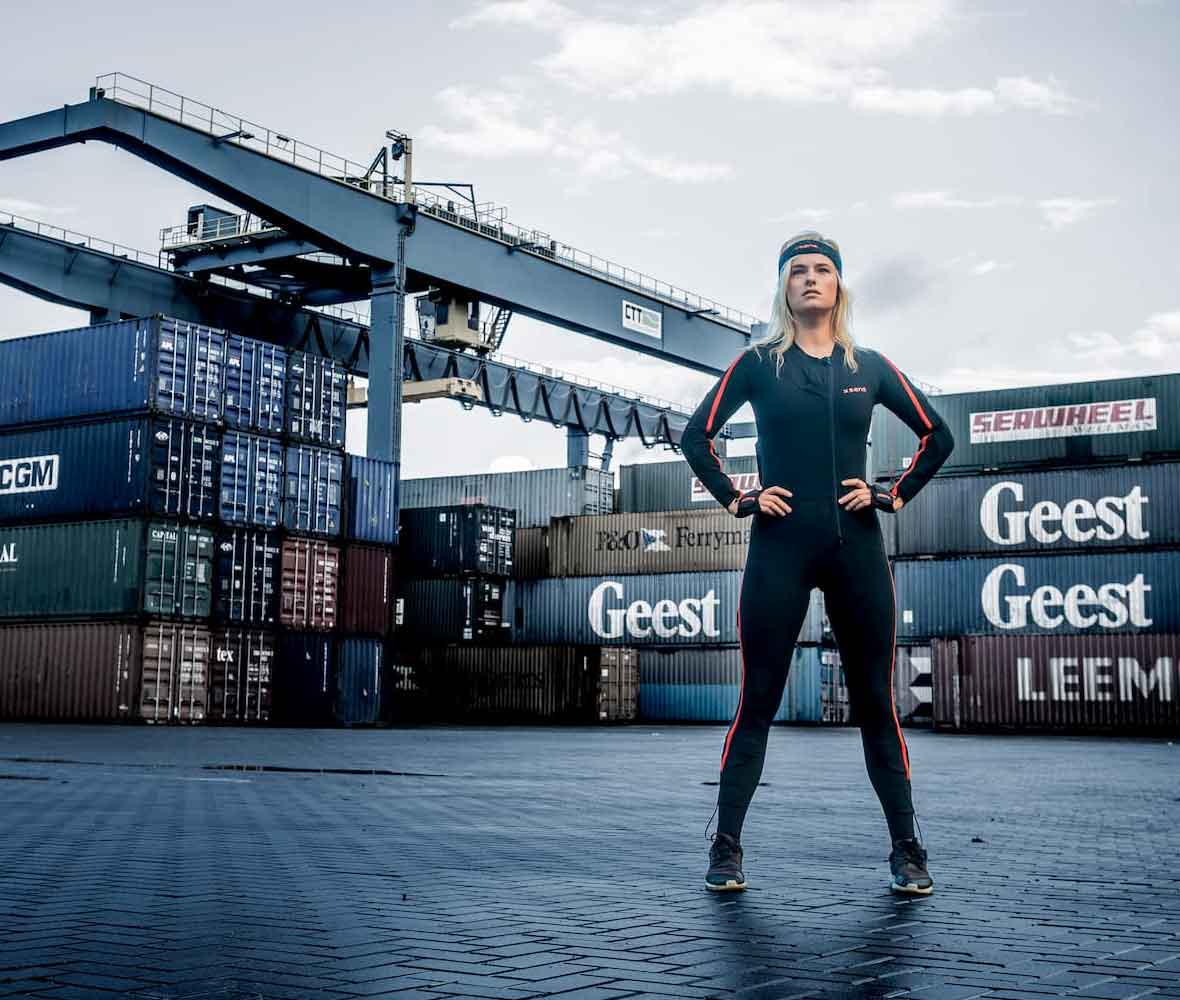
Accurate position tracking from the farmhouse to the warehouse.

Movella is the leading innovator in 3D motion tracking products
Movella motion analysis technology is available in full-body 3D kinematics solutions and 3D motion trackers to integrate in your real-time applications.

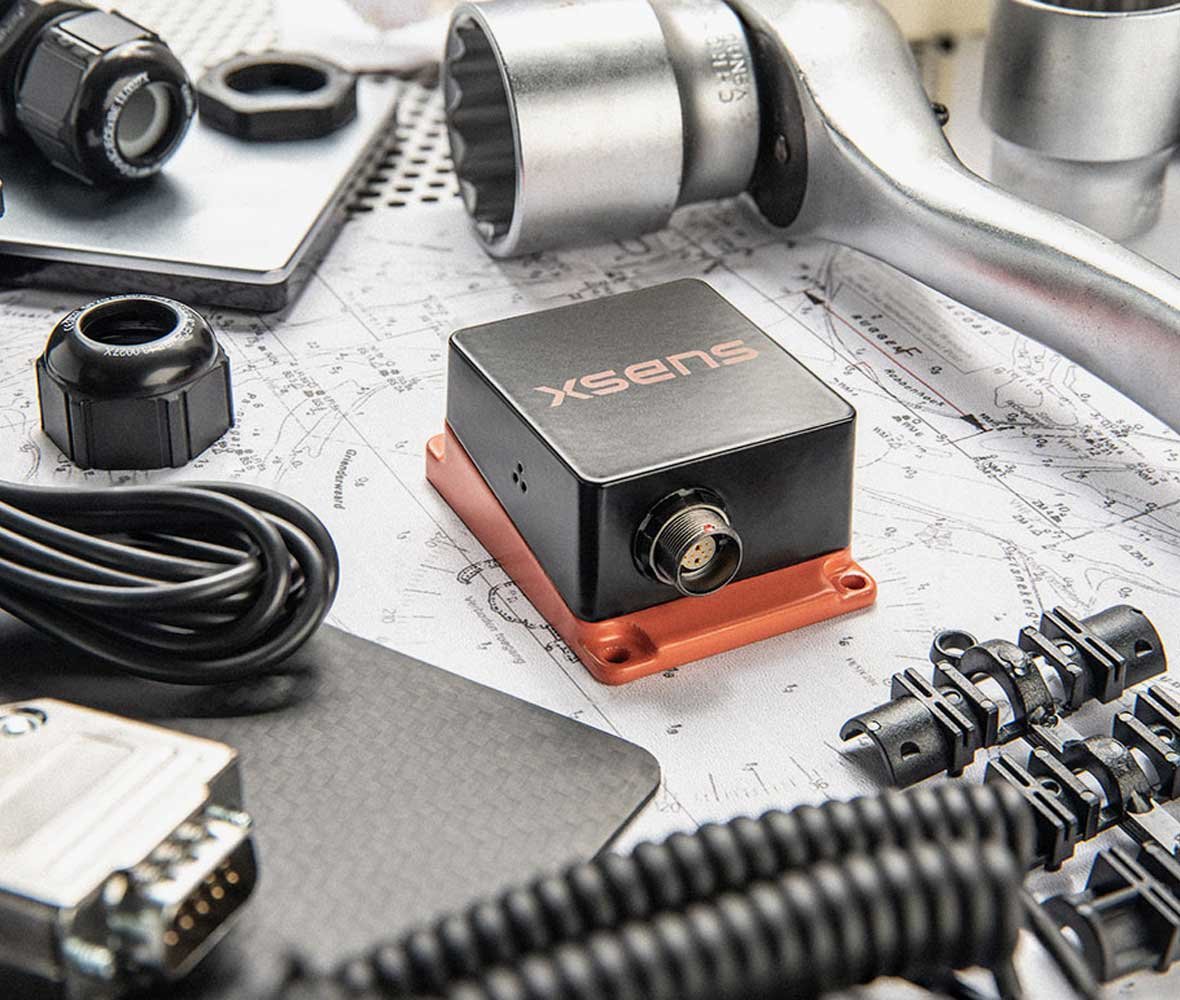
Our Motion Tracker Industrial-grade (MTi) product series is based on over 10 years of research and development, hands-on experience and innovative drive.


Motion tracking recording in unconstrained environments requires lightweight, unobtrusive and body-worn sensors to track motion.


Our platform has the tools to make the lives of coaches and trainers easier, and to help optimize athletic health and performance.

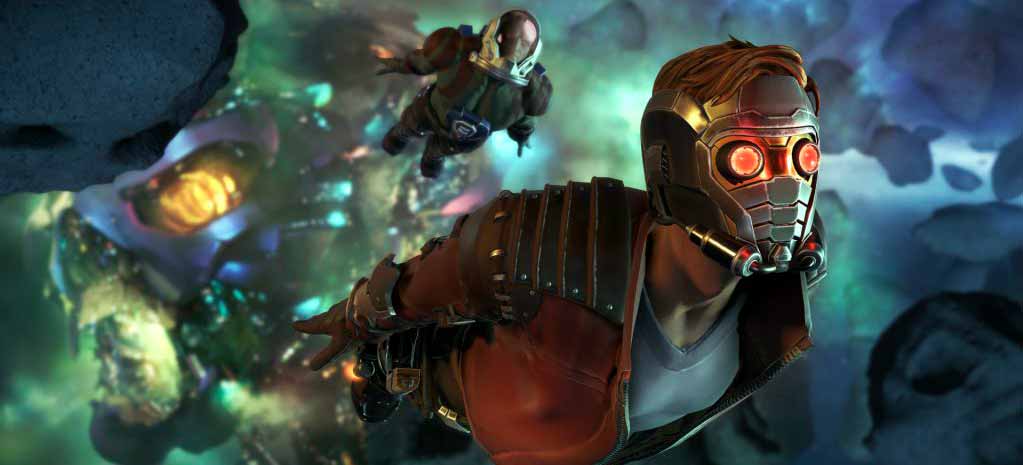
Movella powers Marvel's Guardians of the Galaxy: The Telltale Series
Xsens inertial motion capture solutions present a faster process than keyframe animation.

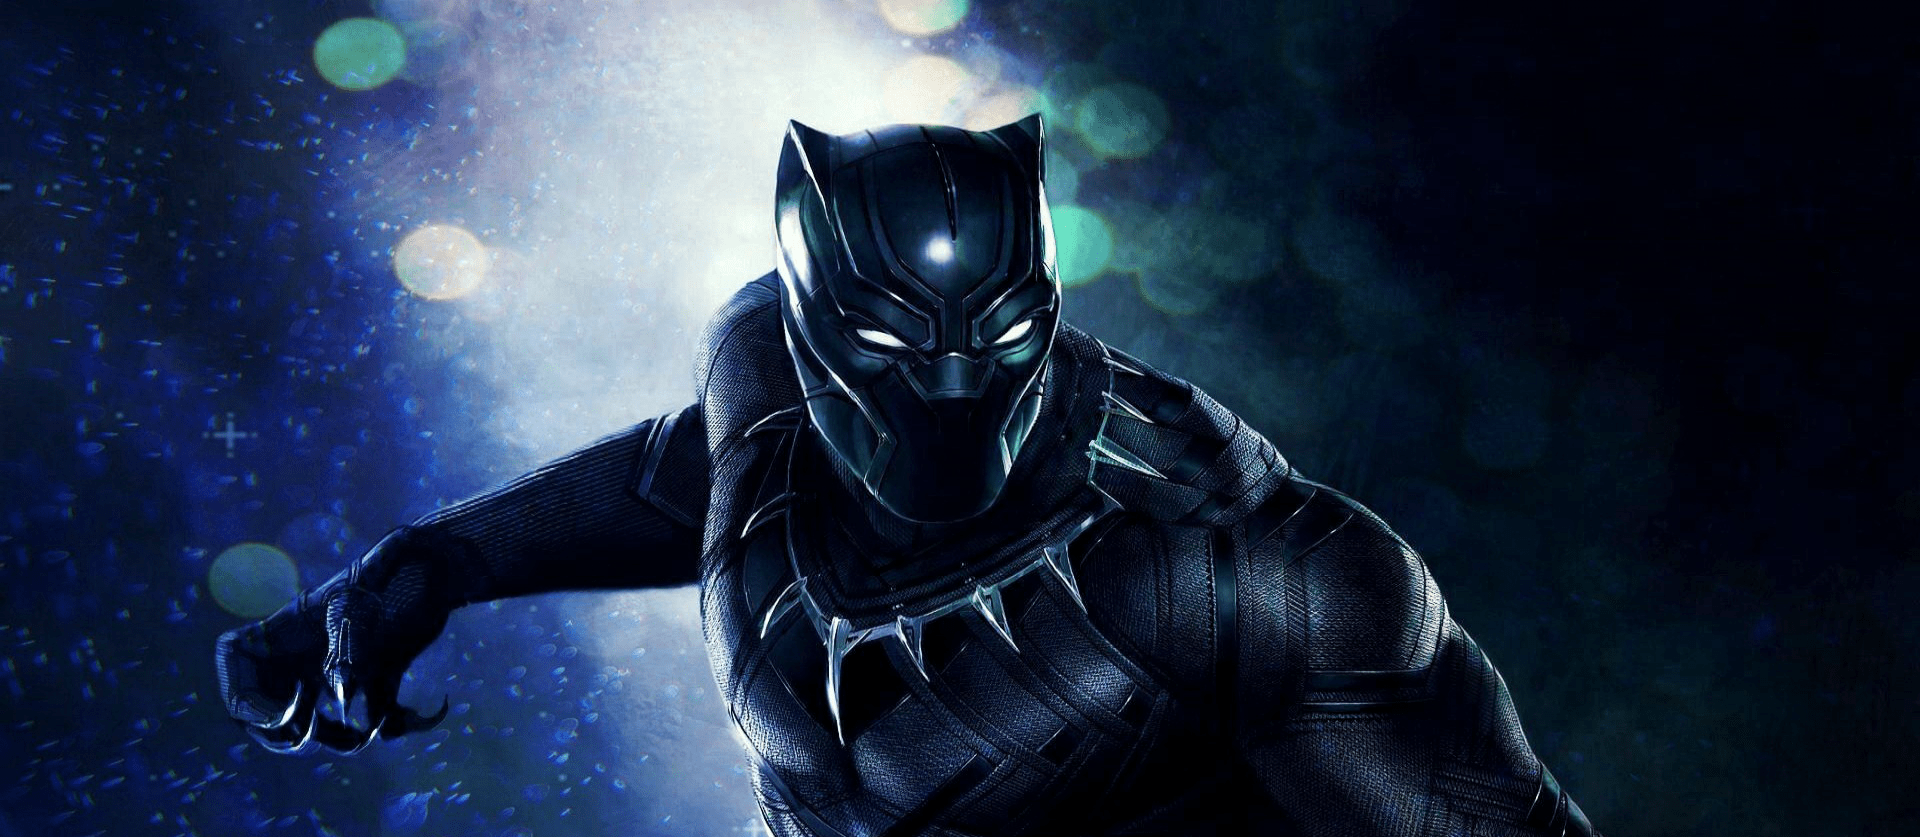
Black Panther’s stunt teams' super-suit
Xsens provided a robust and simple solution that could leverage across a variety of challenges.


Insights to outcomes
Movella is a leading full-stack provider of sensors, software, and analytics that enable the digitization of movement. Movella serves the entertainment, health & sports, and automation & mobility markets.
Our innovations enable our customers to capitalize on the value of movement by transforming data into meaningful and actionable insights. Partnering with leading global brands such as Electronic Arts, EPIC Games, 20th Century Studios, Netflix, Toyota, Siemens, and over 500 sports organizations, Movella is creating extraordinary outcomes that move humanity forward.